A. Doji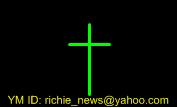
Doji describes indecision market. There is no “real body” at this shape. The opening price is exactly the same with the closing price. At the picture, you can see that the shadow of the bottom is a little bit longer than the shadow at the top. That means there is more buying pressure at the market. Before this period is closed, buyers push the price to be closed at the same level as the opening price.
Doji is not a turning point in the market but it is the opportunity for the market to turn. It’s a moment of indecision where market is still confused by price direction.
B. Hammer and Hanging Man
Both of the pictures above could be Hammer or Hanging Man. Hammer and Hanging Man pattern have identical pattern. What makes them different is only where are they located at the chart. Hammer ends down trends which stop the down trends from going further. Meanwhile, Hanging Man ends up trends which stop the up trends from going further.
Both of them (hammer and hanging man) have two types of shape:
Hammer
Hammer with Empty Candlestick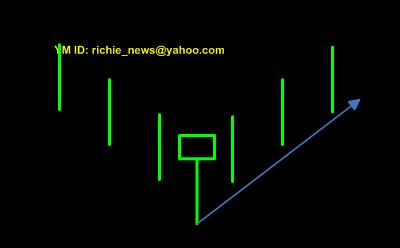
We could see that there is buying pressure at the hammer candlestick which make the closing price is located above the opening price.
According to Munehisa Homma’s theory, this pattern would be followed by bullish pattern.
Hammer with Shaded Candlestick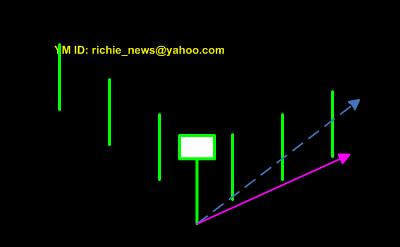
But what happen when the hammer pattern is a shaded one (not an empty candlestick)? Well, we still see that there is still buying pressure at the period but not as strong as we’ve been discussed at the previous example. This time, the closing price is below the opening price. According to Munehisa Homma’s theory, this pattern would be followed by bullish pattern but the angle is much shallower than the previous one.
Hanging Man
Hanging Man with Shaded Candlestick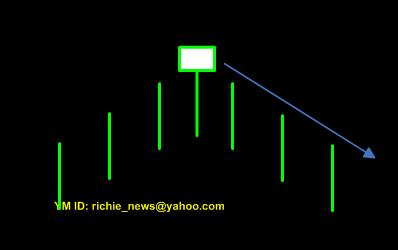
We could see that there is selling pressure at the hanging man candlestick which make the closing price is located below the opening price.
According to Munehisa Homma’s theory, this pattern would be followed by bearish pattern.
Hanging Man with Empty Candlestick
But what happen when the hanging man pattern is an empty one (not a shaded
candlestick)? Well, we still see that there is still selling pressure at the period but not as strong as we’ve been discussed at the previous example. This time, the closing price is above the opening price. According to Munehisa Homma’s theory, this pattern would be followed by bearish pattern but the angle is much shallower than the previous one.
C. Spinning Top
This one is similar to doji but it has more bias. It is also a moment of indecision (as doji) where market is still confused by price direction.
D. High Wave
This one is similar to spinning top but it has much wider range (wider shadow).
This time, market has a big fight between buyers and sellers. Both of them make very strong pressure (buying and selling pressure) but only a few that win the battle. We can see that by looking at the closing price that is not so far from the opening price.
E. Shooting Star
Yup, I know. It reminds us of the hammer and the hanging man pattern. But this time, its shape is upside down. It has the same function as hammer or hanging man pattern. It tells us where market potentially changes its trend direction.
Source Richie
briansignal.blogspot.com
Monday, March 12, 2007
CandleStick Pattern
Posted by Admin at 1:50 PM
Labels: Technical Analysis
Subscribe to:
Post Comments (Atom)

No comments:
Post a Comment