Simple Moving Averages are one of the most popular and easy to use tools available to the technical analyst. They smooth a data series and make it easier to spot trends, something that is especially helpful in volatile markets.
Let’s discuss MA (50). ‘50’ means that the indicator uses 50 latest days to make its average. And I use 1H of time scale in implementing the indicator. The moving average represents the consensus of investor’s expectations over the indicated period of time. If the instrument price is above its moving average, it means that investor’s current expectations are higher than their average ones over the last 50 days, and that investors are becoming increasingly bullish on the instrument. Conversely, if today’s price is below its moving average, it shows that current expectations are below the average ones over the last 50 days.
The classic interpretation of a moving average is to use it in observing changes in prices. Investors typically buy when the price of an instrument rises above its moving average and sell when it falls below its moving average. That’s it!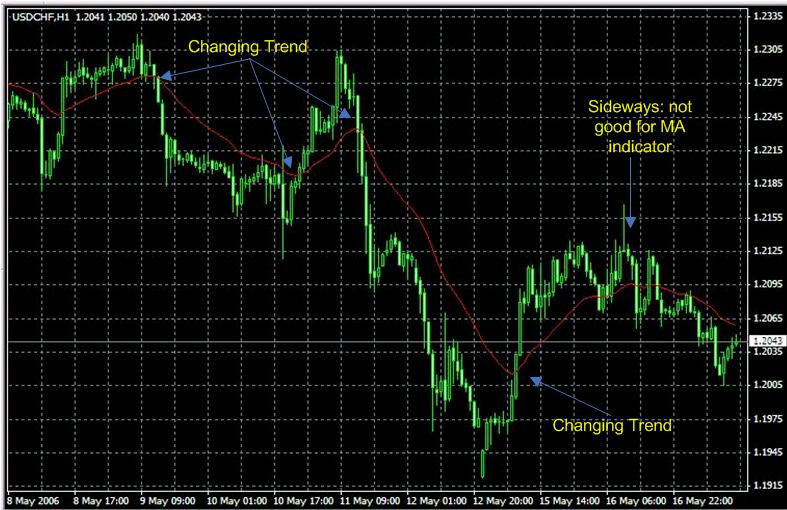
Take a look at the picture above. When market price crosses MA(50), it tells you that the trend will change. But unfortunately all moving averages are lagging indicators and will always be "behind" the price.
But however, I use MA(50) to help me indicating long term bullish trend and bearish trend. But please be very careful when you see sideways market like picture above. This is the weakness of using MA indicator.
[written by richie]
Tuesday, March 13, 2007
Moving Average
Parabolic SAR
SAR stands for Stop and Reverse. The indicator was developed by Welles Wilder, creator of RSI and ADX. Parabolic SAR is more popular for setting exit targets than for establishing direction or trend. While others recommend to establish the trend first, and then trading with Parabolic SAR in the direction of the trend. If the trend is up, buy when the indicator moves below the price. If the trend is down, sell when the indicator moves above the price.
I used ADX to determine when is the right time to enter the market and Parabolic SAR to determine when is the right time to exit.
Take a look at the picture above. That is Usd/Chf pair in strong bearish trend. When we enter the market with strong bearish indication like the picture above, we might want to exit the market for a while and then to go short again at a better level. We can use Parabolic SAR to help us finding our exit door.
If the dots are above the price on your chart then it is still moving downward. But when the dots are below the price on your chart then it’s time to go up, and this is the time for us to exit from our short position.
And if the trend is bullish, then we are going to exit the market when the dots are above the price.
Simple isn’t it?
[written by richie]
Average Directional System
Directional system was developed by J. Wilder in the middle of 1970s as an addition to the system PARABOLIC SAR, and then it was advanced by a number of the analysts. ADX defines the tendency and shows, whether it moves quickly enough to follow it. ADX helps to take benefit, being still in the middle of important trends.
Watch the picture above.
There are three lines in the indicator graph, a trend following line, a positive directional line (+DI) and a negative directional line (-DI). The Blue line tracks trends, the green line (+DI) is a signal to go long and the red line (-DI) is a signal line to go short. What we do is to wait for the blue line (trend line) to rise from below 20 to above 20. That means a trend is being developed.
Then we watch for other lines. When the green line (+DI) crosses above the red line (-DI), it is a signal to go long. And vise versa, when the red line (-DI) crosses above the green line (+DI), it is a signal to go short.
That’s it! So simple.
Recommended period would be ‘14’. This indicator is quite simple to use and quite profitable. But I recommend you not to use the indicator as signals to exit the market. Try to combine it with parabolic SAR and you’ll get great result on your trades.
Good luck.
[written by richie]
Relative Strength Index
A technical indicator developed by Welles Wilder to help investors gauge the current strength of a stock's price relative to its past performance. The usefulness of this indicator is based on the premise that the RSI will usually top out or bottom out before the actual market top or bottom, giving a signal that a reversal or at least a significant reaction in stock price is imminent.
The main purpose of the RSI is to measure the market’s strength and weakness. A high RSI, above 70, suggests an overbought or weakening bull market. Conversely, a low RSI, below 30, implies an oversold market or dying bear market.
But RSI does not indicate a top or a bottom. Sometimes overbought market will be followed by little downward correction in order to gather momentum so it could go up much further. And sometimes oversold market will be followed by little upward correction in order to gather momentum so it could go down much further.
The picture above is an example of implementing RSI on gbp/usd. We can see that the overbought indication is followed by significant downward direction, while the oversold indication is followed by little upward correction go go down much further.
[written by richie]
 forex online