SAR stands for Stop and Reverse. The indicator was developed by Welles Wilder, creator of RSI and ADX. Parabolic SAR is more popular for setting exit targets than for establishing direction or trend. While others recommend to establish the trend first, and then trading with Parabolic SAR in the direction of the trend. If the trend is up, buy when the indicator moves below the price. If the trend is down, sell when the indicator moves above the price.
I used ADX to determine when is the right time to enter the market and Parabolic SAR to determine when is the right time to exit.
Take a look at the picture above. That is Usd/Chf pair in strong bearish trend. When we enter the market with strong bearish indication like the picture above, we might want to exit the market for a while and then to go short again at a better level. We can use Parabolic SAR to help us finding our exit door.
If the dots are above the price on your chart then it is still moving downward. But when the dots are below the price on your chart then it’s time to go up, and this is the time for us to exit from our short position.
And if the trend is bullish, then we are going to exit the market when the dots are above the price.
Simple isn’t it?
[written by richie]
Tuesday, March 13, 2007
Parabolic SAR
Average Directional System
Directional system was developed by J. Wilder in the middle of 1970s as an addition to the system PARABOLIC SAR, and then it was advanced by a number of the analysts. ADX defines the tendency and shows, whether it moves quickly enough to follow it. ADX helps to take benefit, being still in the middle of important trends.
Watch the picture above.
There are three lines in the indicator graph, a trend following line, a positive directional line (+DI) and a negative directional line (-DI). The Blue line tracks trends, the green line (+DI) is a signal to go long and the red line (-DI) is a signal line to go short. What we do is to wait for the blue line (trend line) to rise from below 20 to above 20. That means a trend is being developed.
Then we watch for other lines. When the green line (+DI) crosses above the red line (-DI), it is a signal to go long. And vise versa, when the red line (-DI) crosses above the green line (+DI), it is a signal to go short.
That’s it! So simple.
Recommended period would be ‘14’. This indicator is quite simple to use and quite profitable. But I recommend you not to use the indicator as signals to exit the market. Try to combine it with parabolic SAR and you’ll get great result on your trades.
Good luck.
[written by richie]
Relative Strength Index
A technical indicator developed by Welles Wilder to help investors gauge the current strength of a stock's price relative to its past performance. The usefulness of this indicator is based on the premise that the RSI will usually top out or bottom out before the actual market top or bottom, giving a signal that a reversal or at least a significant reaction in stock price is imminent.
The main purpose of the RSI is to measure the market’s strength and weakness. A high RSI, above 70, suggests an overbought or weakening bull market. Conversely, a low RSI, below 30, implies an oversold market or dying bear market.
But RSI does not indicate a top or a bottom. Sometimes overbought market will be followed by little downward correction in order to gather momentum so it could go up much further. And sometimes oversold market will be followed by little upward correction in order to gather momentum so it could go down much further.
The picture above is an example of implementing RSI on gbp/usd. We can see that the overbought indication is followed by significant downward direction, while the oversold indication is followed by little upward correction go go down much further.
[written by richie]
Monday, March 12, 2007
CandleStick Pattern
A. Doji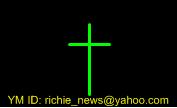
Doji describes indecision market. There is no “real body” at this shape. The opening price is exactly the same with the closing price. At the picture, you can see that the shadow of the bottom is a little bit longer than the shadow at the top. That means there is more buying pressure at the market. Before this period is closed, buyers push the price to be closed at the same level as the opening price.
Doji is not a turning point in the market but it is the opportunity for the market to turn. It’s a moment of indecision where market is still confused by price direction.
B. Hammer and Hanging Man
Both of the pictures above could be Hammer or Hanging Man. Hammer and Hanging Man pattern have identical pattern. What makes them different is only where are they located at the chart. Hammer ends down trends which stop the down trends from going further. Meanwhile, Hanging Man ends up trends which stop the up trends from going further.
Both of them (hammer and hanging man) have two types of shape:
Hammer
Hammer with Empty Candlestick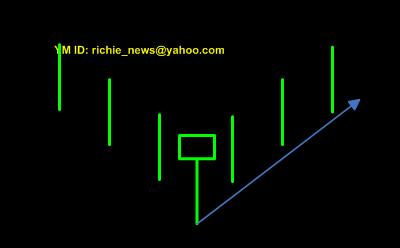
We could see that there is buying pressure at the hammer candlestick which make the closing price is located above the opening price.
According to Munehisa Homma’s theory, this pattern would be followed by bullish pattern.
Hammer with Shaded Candlestick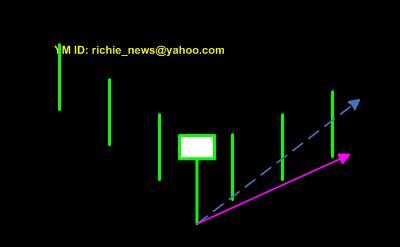
But what happen when the hammer pattern is a shaded one (not an empty candlestick)? Well, we still see that there is still buying pressure at the period but not as strong as we’ve been discussed at the previous example. This time, the closing price is below the opening price. According to Munehisa Homma’s theory, this pattern would be followed by bullish pattern but the angle is much shallower than the previous one.
Hanging Man
Hanging Man with Shaded Candlestick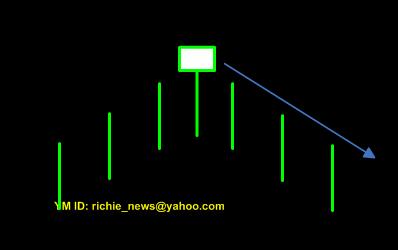
We could see that there is selling pressure at the hanging man candlestick which make the closing price is located below the opening price.
According to Munehisa Homma’s theory, this pattern would be followed by bearish pattern.
Hanging Man with Empty Candlestick
But what happen when the hanging man pattern is an empty one (not a shaded
candlestick)? Well, we still see that there is still selling pressure at the period but not as strong as we’ve been discussed at the previous example. This time, the closing price is above the opening price. According to Munehisa Homma’s theory, this pattern would be followed by bearish pattern but the angle is much shallower than the previous one.
C. Spinning Top
This one is similar to doji but it has more bias. It is also a moment of indecision (as doji) where market is still confused by price direction.
D. High Wave
This one is similar to spinning top but it has much wider range (wider shadow).
This time, market has a big fight between buyers and sellers. Both of them make very strong pressure (buying and selling pressure) but only a few that win the battle. We can see that by looking at the closing price that is not so far from the opening price.
E. Shooting Star
Yup, I know. It reminds us of the hammer and the hanging man pattern. But this time, its shape is upside down. It has the same function as hammer or hanging man pattern. It tells us where market potentially changes its trend direction.
Source Richie
briansignal.blogspot.com
 forex online
